Alphabet — Behind the Profit Surge, Capex Doubles and FCF Plunges: A "Cash Burn" AnalysisAlphabet GOOGL | $317.69 | 1D −7.1% 1W −10.4% 1M −8.2% 3M −7.7% 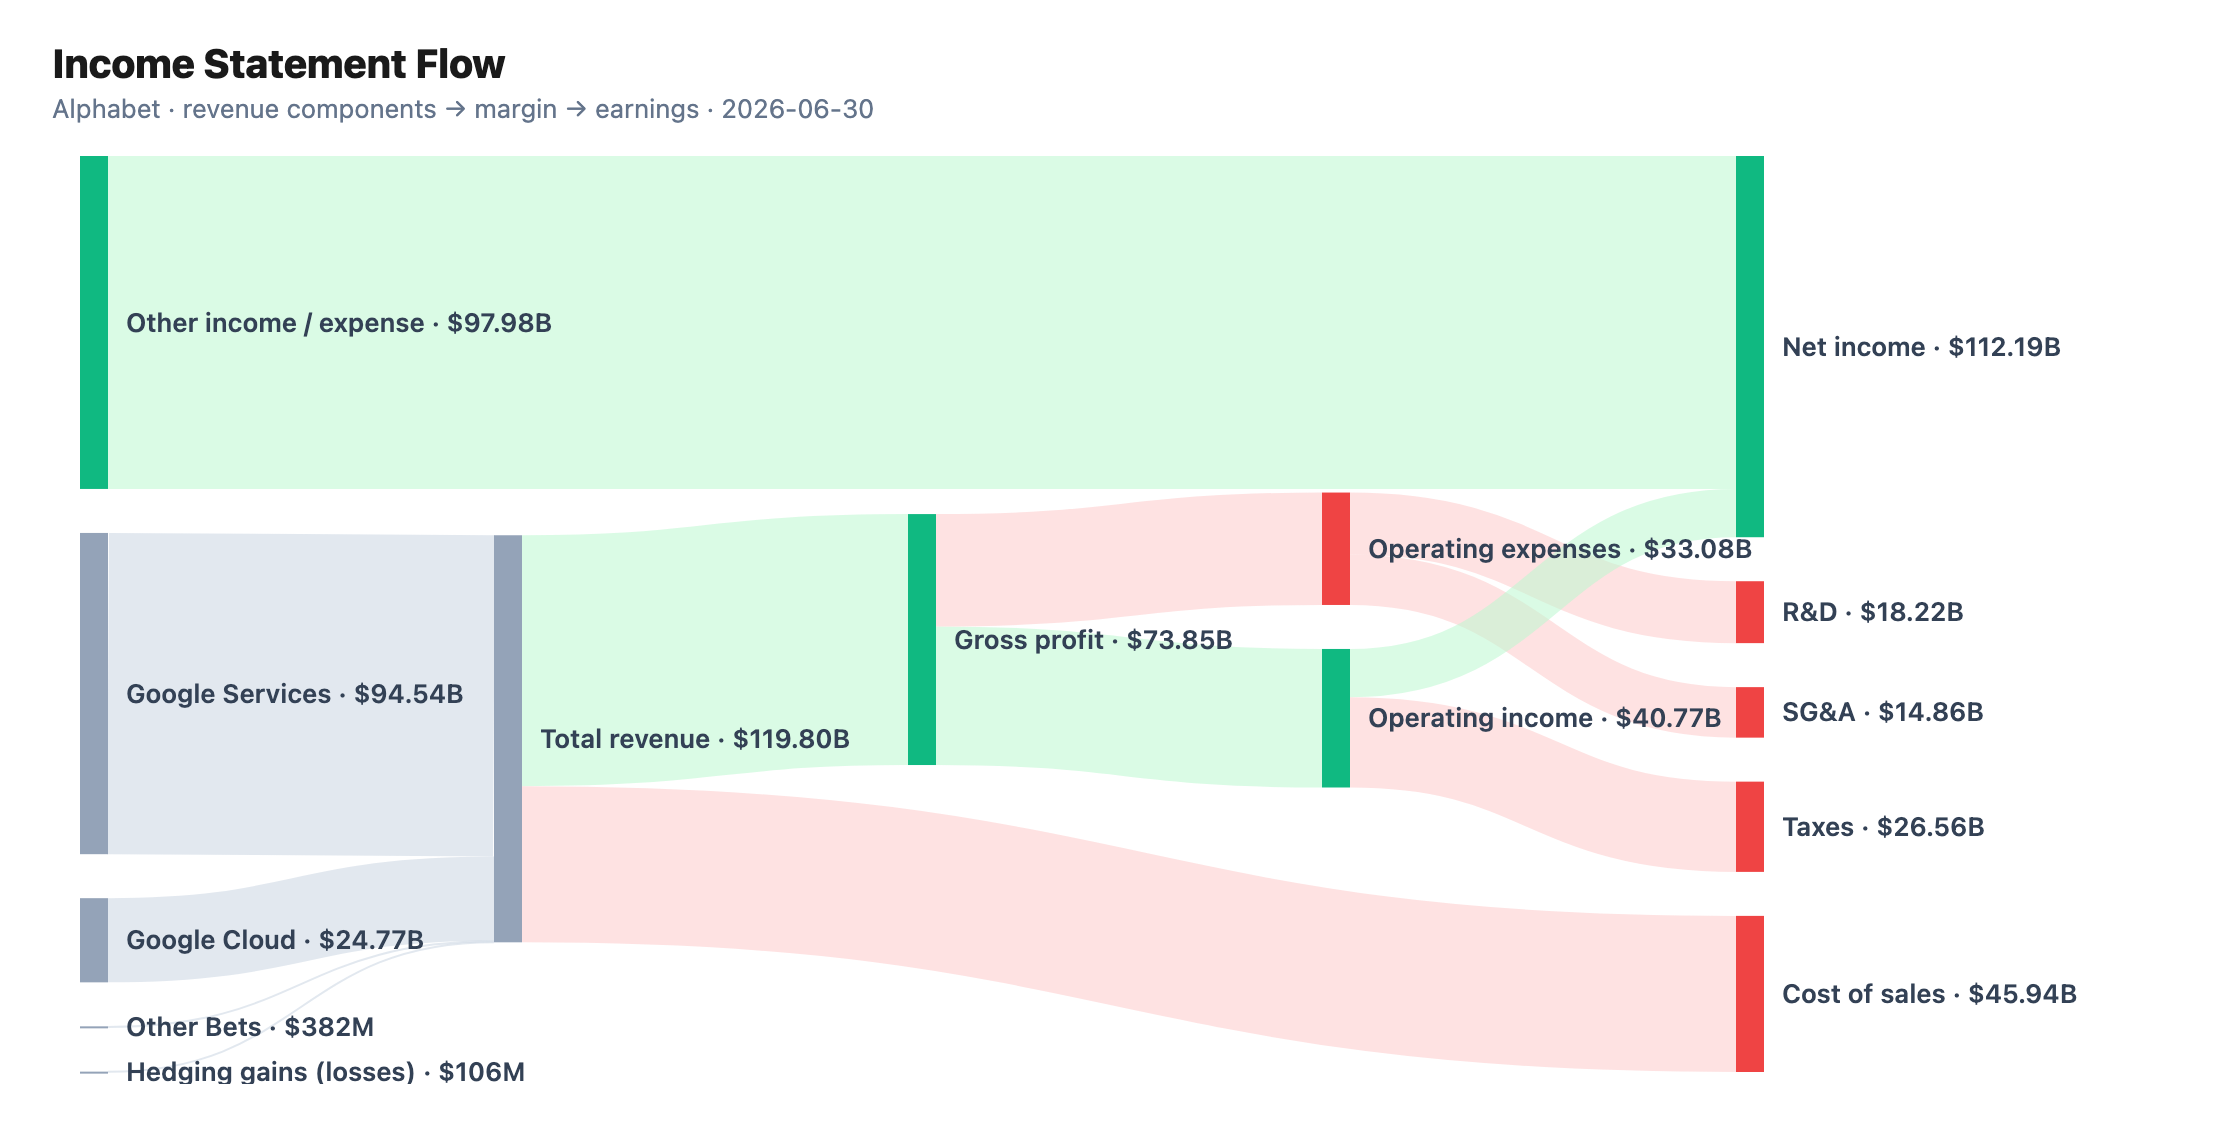 Fiscal Q2 2026 results (period ended 2026-06-30): revenue growth remains solid, but cash flow pressure is the real story this quarter • Doubling capex and plunging FCF are the biggest swing factors this quarter – First-half cumulative capex reached $80,598M, up +103.3% year-over-year — nearly double – Over the same period, free cash flow (FCF) fell to $4,261M, down -82.4% year-over-year – These are first-half cumulative figures, a separate metric from this quarter's income statement, but they are the core evidence in the debate over whether AI infrastructure investment will pay back – While the net profit figure looks very solid on its own, the market's focus is on how sharply actual cash generation is contracting • The $112,193M net profit reflects non-operating effects; true profitability shows up in operating income – Other non-operating income $97,983M equals 81.8% of revenue, significantly inflating net profit – Excluding this non-operating item, actual earnings power is reflected in operating income of $40,770M (operating margin 34.0%, up +30.4% year-over-year) – Reading the net margin at face value distorts the picture, so operating margin and gross margin (61.6%) are the key benchmarks • Gross margin expansion was driven by a slowdown in cost growth – Cost of revenue rose +17.7% year-over-year while revenue rose +24.2%, so the 61.6% gross margin expansion reflects pricing, mix, and scale effects – However, R&D rose +31.9% year-over-year, outpacing revenue growth — driven by proactive expansion of investment in AI infrastructure and R&D, so this cannot be viewed as operating leverage on the cost side – SG&A rose +20.7%, close to the revenue growth rate and relatively stable • Revenue remains centered on Google Services, with Google Cloud's growing share marking a structural shift – Google Services (core services including ads and YouTube) still accounts for an overwhelming 78.9% of revenue – Google Cloud's share is expanding to 20.7% and emerging as a growth driver – The ad-centric revenue structure carries different risk characteristics than a hardware company's single-product ASP risk, but exposure to ad-market conditions, regulation, and competitive intensity still exists – Whether the capex surge translates into future Google Cloud growth and AI service demand is the core of the bullish case; conversely, if the investment payback is delayed, prolonged FCF pressure is the basis for the bearish case — the direction is not yet settled |